Note: This was originally a series of obnoxiously long comments on this post at BoxscoreGeeks.com. If somehow you’ve arrived here without having previously visited that site, you should go there, it’s really good!

There’s no real back and forth, so I’m preserving the posts as originally written without extra editing with the exception of converting the dynamic posting time indicators to something that makes since on a static blog. The times are approximate, and refer to the date this was published 2015 June 4.


At Noon Shawn_Furyan wrote
OK, so you got me. I’ve spent all morning looking at this research. I eventually ended up reading all of Miller and Sanjurjo 2014 after skimming the study cited in your quote: Miller and Sanjurjo 2015.

I did a heavy skim of the later study, and realized that its conclusions were essentially completely dependent on the statistical methodology developed in the earlier study. After reading the earlier study and rereading the abstract and introduction to the later study, my preliminary conclusion is that this research really only applies to repeated shots from a particular location. The first study was a controlled study that looked at shots from a specific point designed on an individual shooter level to be made at a rate of 50%. They did multiple 300 shot sessions with several players on a single Euro team.

They conjectured that the results applied to game situations based on significantly less rigorous evidence. Unless the 2015 study controls for the potential stationary shooter effect in a way not foreshadowed by its introduction, then really all of the new evidence will lack controls for the stationary shooter effect, and so really can’t be inferred for game situations.

In the 2014 study, they do a good job discussing this issue in a kind of buried section, but IMO, their conclusion and abstract don’t discount the claims appropriately (meaning they didn’t find evidence that Kobe can just have a stupid hot streak in a game, when I think that it’s pretty clear that this is the takeaway many people, particularly reporters, are likely to pull from reading those portions of the study).

One situation where the effect could potentially apply is that thing where Curry will try to do a quick pullup from the spot he just hit from on the last possession. Based on the evidence I’ve seen here, I’d recommend trying to keep him from doing that if you’re defending him. This is a conjecture, but it’s closer to the ‘demonstrated’ ‘hot hand effect'[1] than the conjecture by the authors that the effect is general for particular shooters.

That’s the other thing. A primary aspect of the proposed effect is that the authors assume that it’s not really a wide-spread phenomenon. Rather they think that they have identified that particular players are able to get significantly hot, but that most players don’t or that the effect is very subdued in most players.

[1] I would note that the 2015 study will be simultaneously discredited if the 2014 study gets discredited, and that the 2014 study has not been replicated as far as I can tell.

.
At Noon Shawn_Furyan wrote
I’ll note that I’m not saying anything about the statistical methodology. They don’t look particularly convoluted, and shouldn’t take a huge amount of statistical expertise to verify most of the methods, but that would have taken a lot more time and I’ve already devoted a lot of time just examining the claims.
Shawn_Furyan wrote 5 hours ago
That is to say that my first comment should be taken as an interpretation of what we will have evidence for should the statistical methods of the 2014 study stand up to significant scrutiny. I think that this already diverges significantly from what people are likely taking away from the reporting on the studies in question.


At 3PM Shawn_Furyan wrote
I’m in the middle of the second study now. I REALLY don’t like one of their citations to the previous study. I would say that they are mischaracterizing the evidence, which I actually read earlier today:

“Miller and Sanjurjo (2014) [edit: to be clear, this is a self reference, so it’s not plausible that they just misunderstand the findings they are citing] find, in a detailed questionnaire administered to the expert players who participated in their controlled shooting experiment (and did not observe each others’ shooting sessions), that not only do all of the eight players believe that many of their teammates generally shoot better when on a streak of hits, but only one player believed that all of them do. Further, both their ratings (-3 to +3), and rankings, of how well their teammates shoot when on a hit streak are highly correlated with the actual shooting performance of the teammates in Miller and Sanjurjo’s experiment. When this evidence is taken together with the fact that expert coaches and players have much more information to go by than simply whether a teammate has made or missed the last several shots (e.g. how cleanly shots are entering or missing, the player’s shooting mechanics, body language, etc.), what is suggested is that not only can experts identify which shooters have a greater tendency to get the hot hand, but that they may also sometimes be able to tell the difference between a lucky streak of hits and one that is instead due to an elevated state of performance.”

OK, so 8 dudes collectively, but with significant disagreement, identified the ONE SINGLE GUY on their team who’s probably the main shooting threat as most likely to get a hot hand. One of the 8 players gave everyone the same ranking. In the original article, this is presented as a corroborating sort of sanity check (though they don’t discuss alternative hypotheses like the one I just presented, that the agreement is mainly driven by identifying who the shooter on the team is), and kind of spin that into a conjecture that it’s plausible that this means that the study authors have identified an effect that exists in in-game scenarios. I didn’t take much exception to that, but citing it in another paper as if it’s some sort of significant finding, and stripping out the context is laundering the result of it’s lack of rigor. They even take pains to couch the citation in authoritative language: ‘a detailed questionnaire administered to the expert players’, ‘controlled shooting experiment’, ‘highly correlated with’ (remember, n = 8 with one of those possibly not being taken seriously), as well as language that downplays the lack of substance: ‘only one player believed that all of them [benefit from the hot hand][or alternatively, one of them just picked ‘3’ across the board because questionnaires are annoying], spelling out ‘eight’ (as opposed to ‘n=8’) which is kind of easy to miss when reading because of the density, but which is also completely unscannable, and then finally DOUBLING the length of the section by spouting a bunch of completely unsubstantiated theorizations in order to bolster the perceived effect!
I take huge exception to that.


At 4PM Shawn_Furyan wrote
I guess I was closer to the end than I thought, and the appendices weren’t significant. Yeah… I don’t really see the 2015 study as really adding anything of note.

They seemed to recognize in the 2014 paper that having to shoot against a defense and from different locations is a confounding variable, but then they kind of hand wave that away. I would have expected a followup to confront that issue directly, but instead, the produced essentially more of the same, and then doubled down on and ballasted the hand waving.

Also, they haven’t really dealt with a warm up effect directly, they just observed that in some of their trials that it took about 2 shots for everyone to hit their average shooting efficiency. But in games, shots are much scarcer, and there’s a lot more chaos, so I don’t think that the 2 shot warmup period is directly transferrable to game situations.

They also acknowledge, but don’t really take on, the issue that players shoot less efficiently in the beginning of the season.

These are two major effects that could explain any findings of clustered of makes beyond what one would expect if a players shooting efficiency was constant over time. In light of those unanswered issues their attempts to transfer the effect to game situations are very weak, and honestly the papers would have been better if they’d put a lot less emphasis on trying to stretch their research to cover that case. The research just doesn’t address the situation in any meaningful way.


At 5PM Shawn_Furyan wrote
Another thing that I haven’t looked into at all, but which gives me pause, is that in both papers, the authors essentially slam everybody else who’s studied the effect, including explicitly calling out Amos Tversky (who’s obviously no whippersnapper), and tout their pretty simple metrics as the solution to the errors in all of the previous research. Their (in english) claim is essentially that past methods weren’t sensitive enough to clustering, and that the methods developed in their 2014 study are tuned just right to catch the signal [presumably while filtering out the noise adequately]. The number observations in the two studies look on their face to be pretty high, but overall they include only 41 players, and in neither study can the case be made that the player samples are particularly representative of general populations of basketball players within particular leagues, et cetera. The first study has an alarmingly small population of players (n=8), and second has selection criteria so stringent that it only finds 33 candidates that have met the criteria since the mid 80s (and of course we’re talking about the 3 point competition, so we’re already selecting for the most effective shooters). I don’t recall any indication of how many 3 point shooters were selected against, and I’m not sure that it even makes sense to do a second selection if you’re already selecting specifically for the best shooters. Also, in the second study, the median number of observations was like 143, but the biggest outlier, craig hodges was among the hot handiest, but at 454 observations, puts him 4 standard deviations above the median. The researchers report only the average in the study, and use the average to come up with their conclusions, but I do wonder if that one player is significantly positively skewing the distribution.

I also wonder if the study wouldn’t be significantly improved by not filtering out shooters that are already supposedly very effective, but rather looking at all of the shots so that the potential ‘hot hand’ shots are presented in terms of all shots rather than isolating them out on some pretty darn synthetic criteria. I’m not 100% positive that this would be an improvement, but the authors don’t attempt to justify their decision to filter out players from an already highly specific non-representative sample.

One last thing… the authors take pains in both studies to insist that their findings are the ones that are consistent with conventional wisdom (which I guess is assumed to be consistent as well… they don’t really address that…). But the findings of the second study really don’t strike me as consistent with conventional wisdom once you get past the headline. So… the ordering of their hot handedness metric doesn’t seem to be in any way predictable ahead of time. Reggie Miller is apparently inverse hot handed, Peja is the most inverse hot handed… OK Glibert Arenas seems to make sense as being among the inverse hot hand group, but Dirk Nowitzki has less hot handiness than Glen Rice? I’m cherry picking a little, and I’m sure you could make a case for yourself after seeing it, but look on page 13[2]. I mean, is your head nodding vigorously?

[2] Higher on the list means hotter on the manos:
Link to the paper


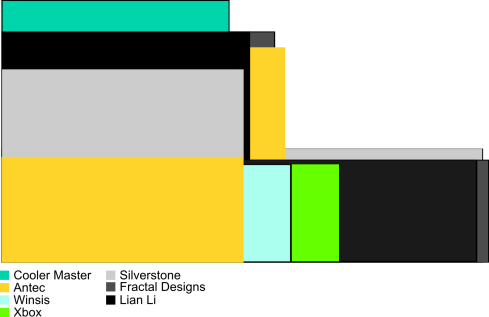
  • Case Name (Included PSU, Size), W” x H” x D”, Case price (+ $45 if PSU not included), Complete Build price after tax
  • Antec ISK-300 (150W PSU, modified micro ATX), 8.7″ x 3.8″ x 12.9″, $87, $732
  • Antec ISK-600 (None, ATX), 10.2″ x 7.7″ x 14.5″, $70 + $45, $801
  • Cooler Master Elite 120 (None, ATX), 9.4″ x 8.2″ x 15.8″, $45 + $45, $773
  • Fractal Designs Node 304 (None, ATX), 9.84″ x 8.27″ x 14.72″, $70 + $45, $801
  • Fractal Designs Node 605 Full ATX (None, ATX), 17.52″ x 6.46″ x 13.74″, $130 + $45, $862
  • Lian Li PC-C37B-USB3.0 (None, ATX), 17.1″ x 3.7″ x 14.9″, $170 + $45, $873
  • Lian Li PC-Q08B (None, ATX), 8.94″ x 10.71″ x 13.58″, $95 + $45, $828
  • Silverstone Sugo SG05 (Optional 300W, SFX), 8.74″ x 6.93″ x 10.87″, $48 + $45, $776
  • SilverStone Sugo SG06Black (Optional 300W, SFX), 8.74″ x 6.93″ x 10.87″, $56 + $45, $785
  • Silverston MILO ML03B (None, ATX), 17.32″ x 4.13″ 13.39″, $60 + $45, $752
  • Winsis WI-02 (200W PSU), 10.43″ x 3.54″ x 10.63″, $58, $700
  • Winsis WI-01 (200W PSU), 10.43″ x 3.54″ x 10.63″, $58, $700
  • XBox 360 (external PSU), 12.17″ x 3.54″ x 10.16″
HTPC Cases Size Comparison

HTPC Cases Size Comparison

Tall Vs. Low Profile

The cases break down into two groups, tall and low profile cases. The low profile cases, the ones that are close in height to the Xbox 360, require low profile video cards. This is the primary factor limiting performance in home theater PC builds, pretty much every thing else can have similar performance characteristics to full sized ATX tower PCs (PC, RAM, SSD etc., though you would tend to be more limited on overclocking capability due to airflow limitations. Some of the wider low profile cases allow for the use of full ATX motherboards, which pretty much gets you 4 slots for RAM instead of 2, and some extra expansion slots.

Included Power Supply

Another interesting aspect of some of the cases is the inclusion of built in Power Supply Units. Notably, the Silverston Sugo has a pretty nice optional 300W PSU included which helps it to be the smallest case that supports a full sized graphics card. The Winsis comes with a built in 200w power supply that gives just enough headroom for a build using a low profile graphics card. The Antec ISK-300 comes with a 150W power supply that cuts things a little close for comfort. Under normal operation, a build using this case should operate within this threshold, but it could spike above 150W of draw, potentially causing stability issues, and perhaps even longevity issues (that is, the PSU might crap out on you before its time). Speaking of which, it’s probable that it’s going to be a pain in the ass to replace any of these built-in power supplies. I think you have the best chance with the Silverstone [ed. actually, I looked into this, it uses a standard small PSU, so it can be replaced easily]. pretty poor chances with the Antec, and if the Winsis PSU dies on you, get ready to replace the entire case (luckily it’s cheap though, so you might actually spend less replacing the entire Winsis case than you do replacing the PSUs from the other units).

Full Size GPU Build

Here are the components that I’m selecting that are common to all of the tall enclosures.

*Comes with 2 Free games. Choose from: Thief, Hitman Absolution, Sleeping Dogs, Deus Ex: Human Revolution and Dirt 3

**This card is the better deal, better performance, and $24 cheaper after rebate. Unless you really want Thief (the other games can be found on sale regularly) get this card

Total Cost of Common Components: $508/$653 (no PSU/PSU)

Low Profile GPU Build

Here are the components that I’m selecting that are common to all of the low profile enclosures.

Total Cost of Common Components: $578/$623 (no PSU/PSU)

Alternative Peripherals

My Recommendation

I think my favorite setup is the Silverstone Sugo SG06 with the Powercolor HD7850 GPU. At nearly 7″, it’s definitely taller than a console, and might be difficult to find a spot for in some entertainment centers, but it’s very narrow, so it will be more likely to fit beside another box than a lot of the other cases. The SG06 is basically the same thing as the SG05, but it has an aluminum faceplate that I think looks a lot better than the exposed fan on the SG05. You’re going to have this thing for a long time, so I would say to spring for the extra $10 to get the better looking case. It will also be of higher quality than the Coolermaster and Winsis boxes (the rest is mostly a tossup, though the Lian Lis are all aluminum, which is mostly why they are so expensive). The bottom line is that this is the smallest box that doesn’t make you compromise on performance, it’s made well, is a good price, and I think it looks damn good as well.

If you want a low profile instead, and can deal with the significantly lower gpu performance (half the gaming performance but you only save $85 on the entire build) then I would probably go with the Winsis WI-02. Sure, it’s kind of a no name brand, but it REALLY looks like a game console. The Antec ISK300 is smaller, but it’s borderline too small for a build with a graphics card (I read about a build where someone had to shave down their low profile card to get it to fit). Also, I think it’s kind of ugly, haha.

Another possibility is to go with one of the larger low profile cases. You still have to stick with the worse GPU, but it would give you expandability to put in a TV Tuner card so that you can DVR over the air TV. You could also get a dedicated sound card to eliminate sound lag and pops that you sometimes get with onboard sound. However, onboard sound is pretty good these days, and all of the motherboards that I’ve selected have optical audio output, so you can drive a surround sound system without a dedicated sound card. Generally speaking expandability is a good thing, but I think that in this context, it’s better to go with a smaller less expandable system.


Rockets fan left the following comment on Andres Perezchica’s recent article for the Wages of Wins Journal concerning the D-League:

To echo a question I’ve raised elsewhere — but haven’t seen addressed — what is a reasonable estimate of the [Wins Produced model’s] error margin? There are some obvious problems with the metric. (For example, it can’t attach a number to plays where a defender’s defense makes an offensive player miss a shot, it values all assists the same, and it does not account for charges drawn.) To be clear, I’m not saying the metric is bunk. But, I think it’s beyond dispute, that it isn’t perfect. Given that it’s not perfect, how imperfect is it? Is [.07]1 really worse than [.09]1? Can the WS make such fine distinctions? I don’t know, and I’d be interested in reading an answer.

One of my biggest complaints about [The Wages of Wins Journal] is that, even though we all accept there’s some [margin of error], in nearly all posts the implicit assumption is that a higher [wins produced] necessarily means the individual contributed more wins. In other words, a player with a .150 [WP48] will be treated as obviously better than a player with a .135. I’m not sure that’s the case. Sorry to (try to) highjack a thread, but I feel like my question comes up in nearly every post — including this one.

Perhaps I can offer a bit of clarification to Rockets fan and anyone else who is unsure of the implications involved in comparing players using the Wins Produced family of production metrics.

The effect of minutes played

As a sample of minutes that a player has played increase, the WP48 as calculated for that period will more closely reflect that players ability, and it’s implications become larger.

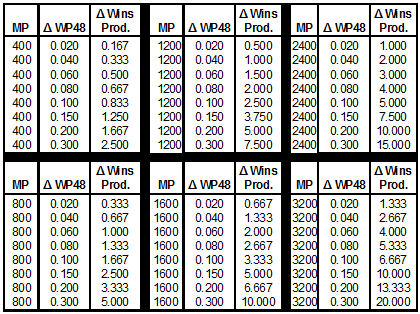
To show this point, here’s a table that lists the difference in production (Δ Wins Produced) between two players for a given number of minutes (assumed to be the same) at various differences in their rates of production (Δ WP48).

Fig. 1 - The effect of minutes on Wins Produced at various WP48's

This table shows that subtle differences in WP48 (Δ WP48 of .020 and less) don’t have a large effect on wins produced until the two players approach starters minutes. So if two starters play 2800 minutes each, and the first of the two has a WP48 of 0.100 and the second has a WP48 of 0.120, then the second player will produce 1.17 more wins over the course of the season, which I would argue is significant. But if those same players have the same WP48, but only play 400 minutes, then the second player will produce only 0.17 more wins, which certainly is not very significant.

On the precision of WP48

WP48 is a precise calculation. All else being equal, having a WP48 of 0.150 is (very slightly) preferable to a WP48 of 0.149. The reason for this is that WP48 is the best model available to describe the rate of production of players in the NBA, and an increase in WP48 in isolation is very likely to lead to more wins2 . To say that player a produced at a WP48 of .150 instead of .149 over the course of a season is akin to saying that he got 1003 rebounds rather than 1000. It’s not a big difference, but everything else being equal, you would take the 1003 over the 1000.

One of the strengths of WP48 however, is that over a season’s worth of minutes, player production as expressed in terms of WP48 is relatively consistent (unlike adjusted plus/minus, for example). This tells us that if a player is productive this year, he is likely to be productive next year3. In practical application the Wins Produced model will generally explain a teams win/loss record for a given season to within 2 wins. Usually there will be a couple outliers that under/over perform the win/loss record predicted by the Wins Produced model by about 4 wins. For more on this, see the following posts by Dr. Berri: Proof and the NBA and The Differing Stories on Durant – and a Brief Thunder Review.

In summary, to say that player 1 has a higher WP48 than player 2 is to say that, when considering only the factors included in the Wages of Wins model, that player 1 was more productive on a per 48 minute basis than player 2. This is true regardless of whether there is a difference of .001 WP48 or of .300 WP48 between the two players. There are other factors outside the scope of WP48 that could mean that player 2 is more productive than player 1 in absolute terms, but these factors are both unknown and of relatively small impact. Therefore, when evaluating the production of players in the NBA, it is best to assume that player 1 is more productive than player two, at least until the Wages of Wins model is improved to have a smaller error, or until another model with a smaller margin of error becomes available.

1 Rockets fans question actually used the numbers .7 and .9, but I’m assuming that .07 and .09 were meant as the former numbers only come about in very small sample sizes and are not really reflective of a players actual ability.

2Note that I am using this number for pedagogical purposes and in reality, if a player increases his WP48 by .001 in say 2400 minutes of play, he will have helped his team by 0.058 wins which is not likely to have any parctical effect on the teams win/loss record.

3There are some well know caveats to this generalization. Very early career production (i. e. the first couple seasons a player plays in the NBA) is often much more volatile than production from mid-career seasons. Players are also less likely to maintain production after the age of 30, and especially after the age of 32.

Update:

Alex asks:

I’m assuming that Rockets fan’s question was actually in regards to the statistical error associated with wp48. For example, not only does Dr. Berri not like adjusted plus/minus because it doesn’t correlate well across seasons, but within a season the errors are so large that it’s difficult to compare players. I’m making numbers up, but Kevin Durant might be a +6 but the error term is +- 5, meaning he could be anywhere from amazing to average. What is that number, the +-5, like for wp48? If a player posts a .100 one year, what would he have to post the next year for me to be pretty sure he got better, as opposed to there being a good chance he played just as well? .101 seems non-significant to me, but .105? .110?

Interesting question, Alex. I don’t think that there’s a really solid answer to that. Mostly, WP48 is a summation of individual player production, so I think that my assertion that any increase in WP48 is good, all else being equal, stands. To find an area of the Wins Produced model that would allow for the possibility that a player with a .100 WP48 is really more productive than a player with a .101 WP48, you would have to look at the parts of the model that are not specifically tied to the box score numbers produced by a particular player.

The area of the model which has the largest potential to lead to some inaccuracy in a players WP48, in my opinion, is the way that individual defense is incorporated. In case you are unaware, WP48 does incorporate team defense, and distributes this among the teams players based on minutes. It should be noted however, that adding individual defense has a relatively small affect, even in extreme cases (i.e. if a player has a WP48 of 0.000, then even if that player is the best individual defender in the league, he would not be able to approach an average WP48 of .100 if individual defense were incorporated into WP48, in fact, defense in general has a relatively small impact compared to shooting efficiency, rebounds, and turnovers, all of which are well accounted for in WP48). All of the factors that most affect wins are incorporated into WP48 already. The reason that individual defense is left out of WP48 is that it would add a lot of complexity to the model without increasing it’s explanatory power by much. For more discussion on this topic, see Dr. Berri’s article Incorporating Defense from The Wages of Wins Journal. Here is a relevant excerpt:

Models are not supposed to be “perfect” (whatever that means). When I and my colleagues construct models, we are trying to construct a simplified version of reality that allows us to focus on what is important (and answer the various questions we pose in our research).That is what I think Wins Produced does. It is a simple and accurate measure of performance, based on the theoretically sound idea that wins are determined by a team’s offensive and defensive efficiency. This model ultimately tells us that wins are primarily determined by shooting efficiency, rebounds, and turnovers. Yes, other issues matter. But players who do not score efficiently, who fail to rebound (given their position), and/or turn the ball over excessively, will not help you win games.

So, my answer is that we might conservatively estimate that a players WP48 is within 0.030 of his “true” win production per 48 minutes for players who excel in, or conversely are extremely poor with regard to, all of the areas that are not considered in the calculation of WP48. Any given player’s WP48 will necessarily be close to his “true” win production per 48 minutes. If he is a great individual defender, then WP48 may slightly undervalue him. If his assists are better than the the average assists, then again, WP48 may (very, very slightly) undervalue him. If one wishes to take those areas which are not explained by WP48 into account, then it is ones prerogative to do so, but caveat emptor that you are deviating from the science, and unless you know the true impact on wins of the variable you are adjusting, you are more likely to get a less accurate picture of the player’s true production than if you had assumed that WP48 was the player’s true production.


Note: If you wish to understand the justification for using PAWS40 for the purpose of evaluating college prospects, see:http://dberri.wordpress.com/2007/06/26/win-score-and-the-nba-draft/

For a discussion on how college production translates to NBA production, see: http://dberri.wordpress.com/2009/06/14/superstar-search-in-the-nba-draft/

It finally happened. The event that embodies the culmination of the hopes and dreams of each of the NBA’s less fortunate fans, whether they hail from New York, Northern California, New Jersey or Minnesota. The NBA Draft is a time when such fans look to the future, confident about their favorite teams prospects for improvement. It is a time of infinite possibilities, a time when a single draft pick can change the face of a franchise. Fans hope to nab the next MJ, Lebron, Shaq, or Duncan. Will John Wall be the next Chris Paul or the next Earl Watson? Will undrafted Brian Zoubek be the next Ben Wallace or the next John Doe? In this Draft review, we will try to answer those questions, and more.

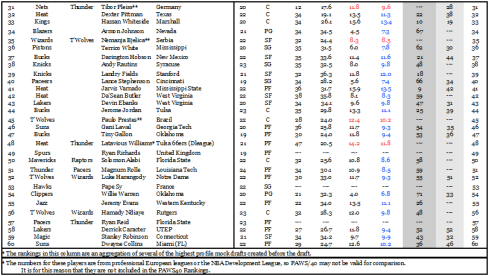
Let’s kick things off with a summary of the order in which players were drafted on Draft Day (See figures 1.1 and 1.2)

Fig. 1.1 - 2010 NBA Draft - Round 1

Fig. 1.1 - 2010 NBA Draft - Round 1

Fig. 1.2 - 2010 Draft - Round 2

Fig. 1.2 - 2010 Draft - Round 2

Nobody was surprised when the Wizards used the #1 draft pick to take John Wall. Every major Mock Draft available had Wall filling the top slot. Similarly, Ekpe Udoh, and Greg Monroe were considered consensus top-10 talent, and Eric Bledsoe, Avery Bradley, Daniel Orton and Craig Brackens were all considered solid first round picks. When we look at overall production via the PAWS40 metric however, we see a different story.

This metric, which is adjusted on a per 40 minute basis (see the PAWS40, and PAWS40 Rank columns in Figure 1), shows us that John Wall was a slightly below average producer this last year in college with a PAWS40 of 10.0 (average PAWS40 from 1994-2005 for college players was about 10.2), and there were 41 players in the draft that were more productive on a minute adjusted basis. Udoh, and Monroe fared very slightly better, each producing PAWS40 of 10.1. As for Eric Bledsoe, Avery Bradley, Daniel Orton and Craig Brackens, despite being first round draft picks, each were among the 10 least productive of the 79 draft prospects we looked at. A full 27 draft prospects that were more productive than these first round picks went undrafted.

Draft Winners

So which teams came out ahead in this years draft?

Oklahoma City Thunder

The Thunder were this year’s Blazers. They were involved in 4 first round and 4 second round picks. They made the most notable move in the draft by trading away their 21st and 27th picks, Craig Brackens (horrendous PAWS40 of 6.3, especially for a 22 year old) and Quincy Pondexter (who was actually quite a bargain at #26 with a PAWS40 of 12.5), in return for the 3rd most productive player in the draft, Cole Aldrich (PAWS40 of 15.2). In the second round they acquired big man Tibor Pleiss of Germany from Atlanta (who had acquired him from the Nets previously), and Latavious Williams who spent last season in the NBA Development League playing for the Tulsa 66ers where he achieved a PAWS40 of 11.8. Essentially, the Thunder went into the Draft with 3 first round draft picks, the highest of which was 18th, and came out of the draft with the 3rd most productive player, one player that was productive in the D-League, as well as a slew of longshot prospects which includes a 7 foot tall German who scores fairly efficiently and rebounds at a high rate (any perceived parallels to Dirk Nowitzki are strictly unintentional).

Sacramento Kings

The Kings went into the draft with the 5th and the 33rd pick. At 5, they drafted DeMarcus Cousins, the 19 year old center from Kentucky who was the 2nd most productive player in the draft. Cousins is probably the best overall prospect from this years draft given the high level of production he was able to achieve at such a young age. NBA draft commentators knocked him for his lack of athleticism, but college production has been shown to be correlated with NBA production, whereas, say, vertical leap has not. At number 33, the Kings drafted another center, Hassan Whiteside, who was the 10th most productive of the 79 players analyzed. It should also be noted that the Kings recently acquired the very productive Samuel Dalembert (2010 wp48 of .243), in exchange for the unproductive Spencer Hawes (2010 WP48 of -0.007) and Andres Nocioni, an old and formerly, but no longer productive small forward (2010 WP48 of -0.015). This leaves the Kings with two fewer unproductive players and a productive veteran center, and two rookie centers that have been productive at the collegiate level.

New Jersey Nets

The Nets took power forward Derrick Favors with the 3rd Pick in the draft, and while Favors was only ranked 23rd in terms of PAWS40, he was the youngest player in the draft, and still managed to produce at an above average clip. They also acquired the Hawks first round selection, the 23rd pick Damion James, who turns out to have been the most productive player in the draft (and I might add, has also spent the last 4 seasons playing here in Austin, TX, for UT), in return for their 27th and 31st picks, Jordan Crawford (PAWS40 9.9) and Tibor Pleiss of Germany.

Milwaukee Bucks

The Bucks took 4 players in the draft. They ended up with an above average power forward (Larry Sanders, PAWS40 12.5) with the 15th pick, an above average small forward (Darington Hobson, PAWS40 11.6) with the 37th pick, and an above average center (Jerome Jordan, PAWS40 11.1) with the 44th pick. They also acquired 19 year old power forward Tiny Gallon with the 47th pick, who was a bit below average, but at 19 years old, could potentially improve relative to his current PAWS40 rank of 53.

Honorable Mentions

The 76ers came up with the most productive guard in the draft, Evan Turner, with the second pick. The Raptors got Ed Davis, who is only 20 and was also the 8th most productive player with the draft, but if they lose Chris Bosh to free agency in two weeks, then they’ll likely have lost ground overall as well. The Blazers had the 22nd pick and the 34th pick. Though many above average picks were available at both positions, both of these picks, Elliot Williams and Armon Johnson respectively, were well below average. However the Blazers were somehow able to foist unproductive veteran forward Martell Webster on the Timberwolves in exchange for their 16th pick, Luke Babbitt, who was one of the most productive small forwards in the draft.

Draft Losers

If there are winners, then there must be losers. Let’s take a look at the teams that fared worst on Thursday.

Wizards

The Wizards ended up with 5 draft selections, including the number 1 overall pick, and didn’t manage to come up with a single player that produced at an above average level this last year. As for the #1 pick, it’s difficult to be too hard on the Wizards for doing what everyone expected them to do. In 5 years if John Wall is a merely average player, nobody will blame the Wizards front office for drafting him. If they had gone with another draft pick though, and John Wall ended up being more productive than his college production would indicate, then the Wizards front office would be widely seen as inept. On the up side, Wall is only 19 years old, and still managed to produce at a level that was close to average, so there is some room to hope that he ends up living up to the hype, though the odds do not favor this outcome.

Golden State Warriors

With the 6th overall pick, the Warriors chose Baylor junior Ekpe Udoh, a 22 year old power forward. There really are no redeeming qualities to this pick. Udoh was below average, and is too old to be expected to improve his position relative to the rest of this draft class. Further, he will be guaranteed a number 6 pick’s salary while most likely being unproductive in the NBA.

New Orleans Hornets

If financials are not considered, the Hornets are one of the the biggest losers of the draft. They traded the third most productive player in the draft, Cole Aldrich (PAWS40 of 15.2), for Quincy Pondexter (PAWS40 of 12.5) and the 6th least productive draft prospect, Craig Brackins (PAWS40 of 6.3) along with Morris Peterson who produced in the negative range for the Hornets last year. That being said, this move was clearly motivated by the desire to dump Peterson’s $6.6M salary while avoiding having the guaranteed contract of an 11th pick (rookie salaries of first rounders scale according to draft position such that the 1st pick makes the most, and the 30th pick makes the least). The Hornets have saved a lot of money, and many teams came out with worse picks than Quincy Pondexter, but it’s always hard to see bad basketball moves made for financial reasons.

Detroit Pistons (Sorry DJ, maybe next year)

Greg Monroe tied Udoh for second least productive top-10 draft pick with a PAWS40 of 10.1. Unlike Udoh, he is only 19, so he has time to improve. Still, there were many productive big men in this draft. There was no reason to gamble the 7th pick on power forward who hasn’t shown that he can be productive.

Boston Celtics

The Celtics threw away the 19th pick of the draft on Avery Bradley (who also, though I’m somewhat less excited to say it, played here in Austin, TX this past season). Avery was the third least productive player in the draft, and even though he is only 19 years old, at half the production of an average college player (his PAWS40 was an abysmal 5.4), can not be justified as the 19th overall pick.

Undrafted Gems

There were several productive players in the draft that sat through 60 picks without hearing their name called. Many of the players from the figure 2 below achieved good numbers in smaller conferences. Most are also 21 years old or older and thus don’t have the allure of limitless upside. Still many of these players are certainly worth a 14th or 15th roster slot.

Fig. 2 - Undrafted Prospects

Fig. 2 - Undrafted Prospects

Brian Zoubek

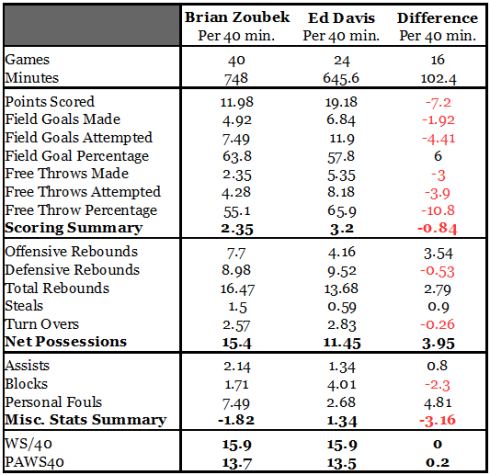
Brian Zoubek filled up every category in the stat sheet last season for Duke (excluding 3 pointers, but including turn overs and especially fouls). His stats don’t look great at a glance, but he only played 18.7 minutes a game. If we look at his stats per 40 minutes, he looks much better. Of course, he fouls at a very high rate, so his minutes will be limited for the foreseeable future, but he is likely to be very productive for the minutes that he is able to play. Really, what team couldn’t use a productive center to soak up 10-20 minutes per game? In order to put things into perspective, Figure 3 compares the per 40 minute production of the undrafted Brian Zoubek, and that of the 13th pick, Ed Davis since the two played in the ACC, played comparable minutes, had the same PAWS40, and are both big men.

Fig. 3 - Brian Zoubek vs. Ed Davis

Fig. 3 - Brian Zoubek vs. Ed Davis

In per 40 minute terms, the two are evenly matched. Both are efficient scorers, but Davis shoots more, so he gets a bit of an advantage. Zoubek is much better than Davis in getting extra possessions for his team and has a huge advantage in that category. Davis though has a large advantage in blocks and personal fouls. On the whole though, the per 40 minute production of the two players this last season was equal. Being that Brian Zoubek compares well with Ed Davis who was a (legitimate) lottery pick, it is clear he would be a very nice pickup for any team that could use a center that doesn’t have to start immediately.

Zoubek is the only player at the top of the undrafted players list to come from a major conference. Still any teams that were to pick up Jeremy Lin, Artsiom Parakhouski, or Omar Samhan are likely to find that they have a more than serviceable player on their hands.

Other Thoughts

Many a Kentucky player seems to have profited from playing on the same team as DeMarcus Cousins. Cousins had a stellar PAWS40 of 15.6. The four other players from Kentucky drafted (all in the first round, and of course Wall was even drafted before Cousins) had an average PAWS40 of 8.3. Perhaps 4 thank you notes are in order. Avery Bradley also seems to have profited from the success that Damion James and Dexter Pittman brought to the Longhorns. He was drafted before both though he did not achieve even half of the production of either.


-Shawn Ryan

P.S. This article was written well before the the main free agent moves that have happened at this point. I will try to add a follow-up post or two in the near future to look at some of the issues raised given the current, and quite different landscape of the NBA. Also, it looks like Chris Bosh did leave Toronto, so acquiring Ed Davis, while certainly not a bad move, is still not likely help a whole lot.

Update: Big thanks to Sportsfanatic613 for corrections.

If anyone else has any comments or criticism, let me know. I’m new at this, so I’m very interested in knowing what you all think, and how the I can improve. I’ll respond to every comment that I can.